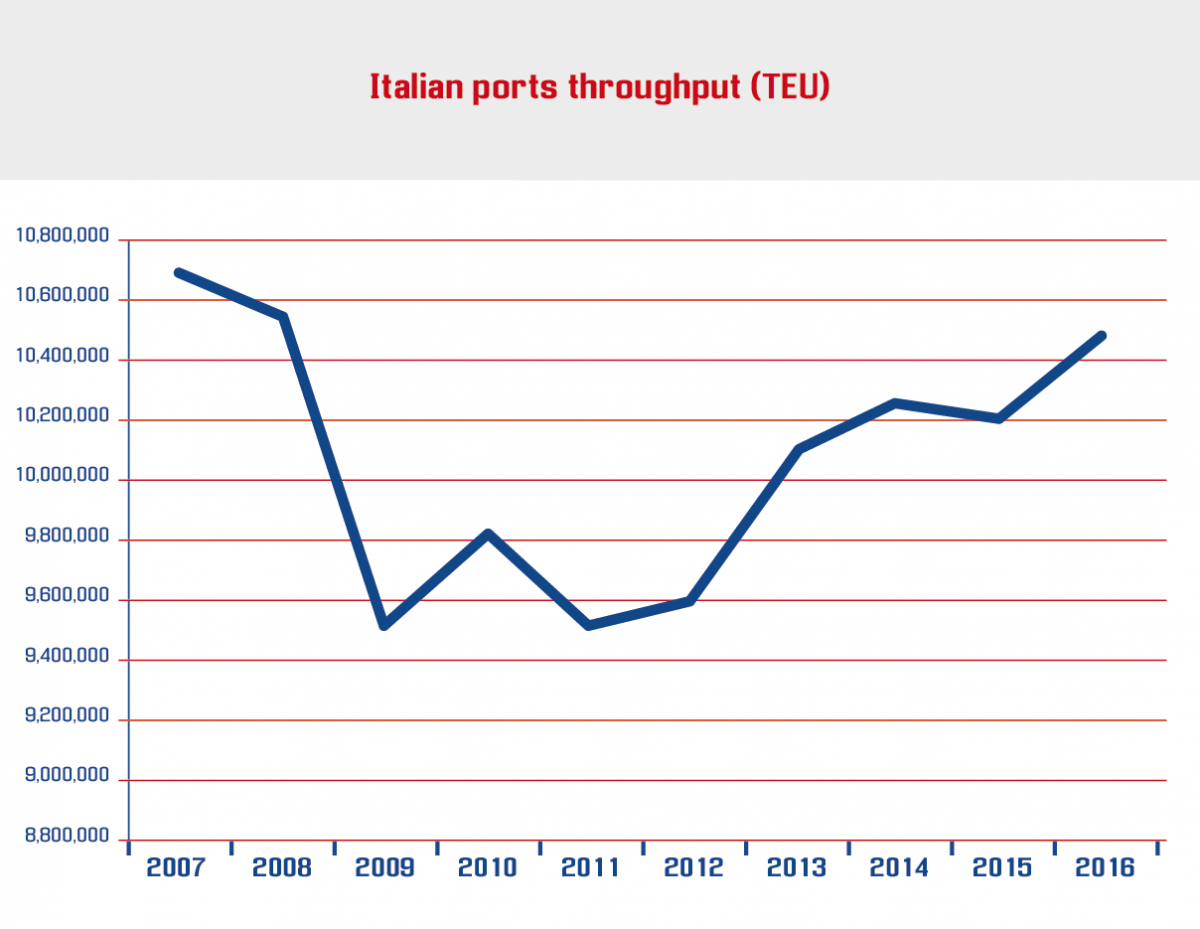
Italian ports handled 10.51 m TEU in 2016. While this corresponds to an increase of 2.9% compared to the previous year, the result should be put in perspective with the throughput volumes before the onset of the 2008 global financial crisis.
2016 saw 1.3% fewer boxes (143,000 TEU) handled in Italian ports than in 2007, which leads to a compound annual growth rate of -0.1% for 2007 to 2016.
Gateways and transhipment hubs - differing trends
To better understand the results, Italy’s ports must be split in two different groups: hubs that handle mainly transhipment cargo (over 80% of total throughput) and gateways that mainly cater to domestic import and export.
When comparing the performance of the two different types of ports over the past ten years it becomes clear that gateways are achieving better throughput figures than hubs. It is true that the enlargement of the Suez Canal led to larger tonnage being deployed and many carriers have been facing the need to establish their own hubs and optimise the service network ever since. However, the Mediterranean is driven by fierce competition. This is especially the case because different countries are competing for the same cargo - but offer very different options, for instance in terms of terminal infrastructure, taxation, energy and labour costs.
As a result, Italian hubs recorded a 3% average yearly decrease when looking at 2007 to 2016. Put in absolute numbers, this means that Italian transhipment hubs handled a volume of 3.5 m TEU in 2016, whilst the pre-crisis throughput figure of 2007 amounted to 4.8 m TEU. This development corresponds to a decline of 26.5% when comparing the figures of 2016 with those of 2007.
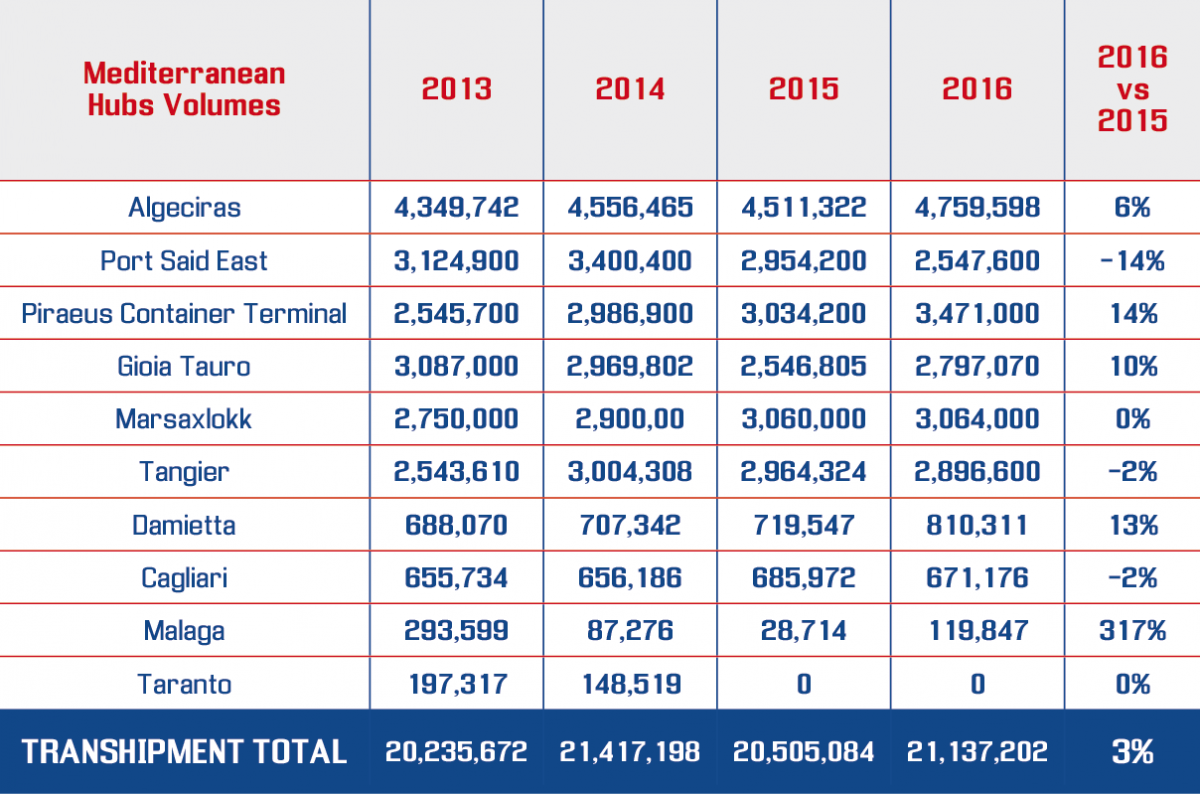
In the Mediterranean, the main transshipment ports recorded a 3% increase in 2016.
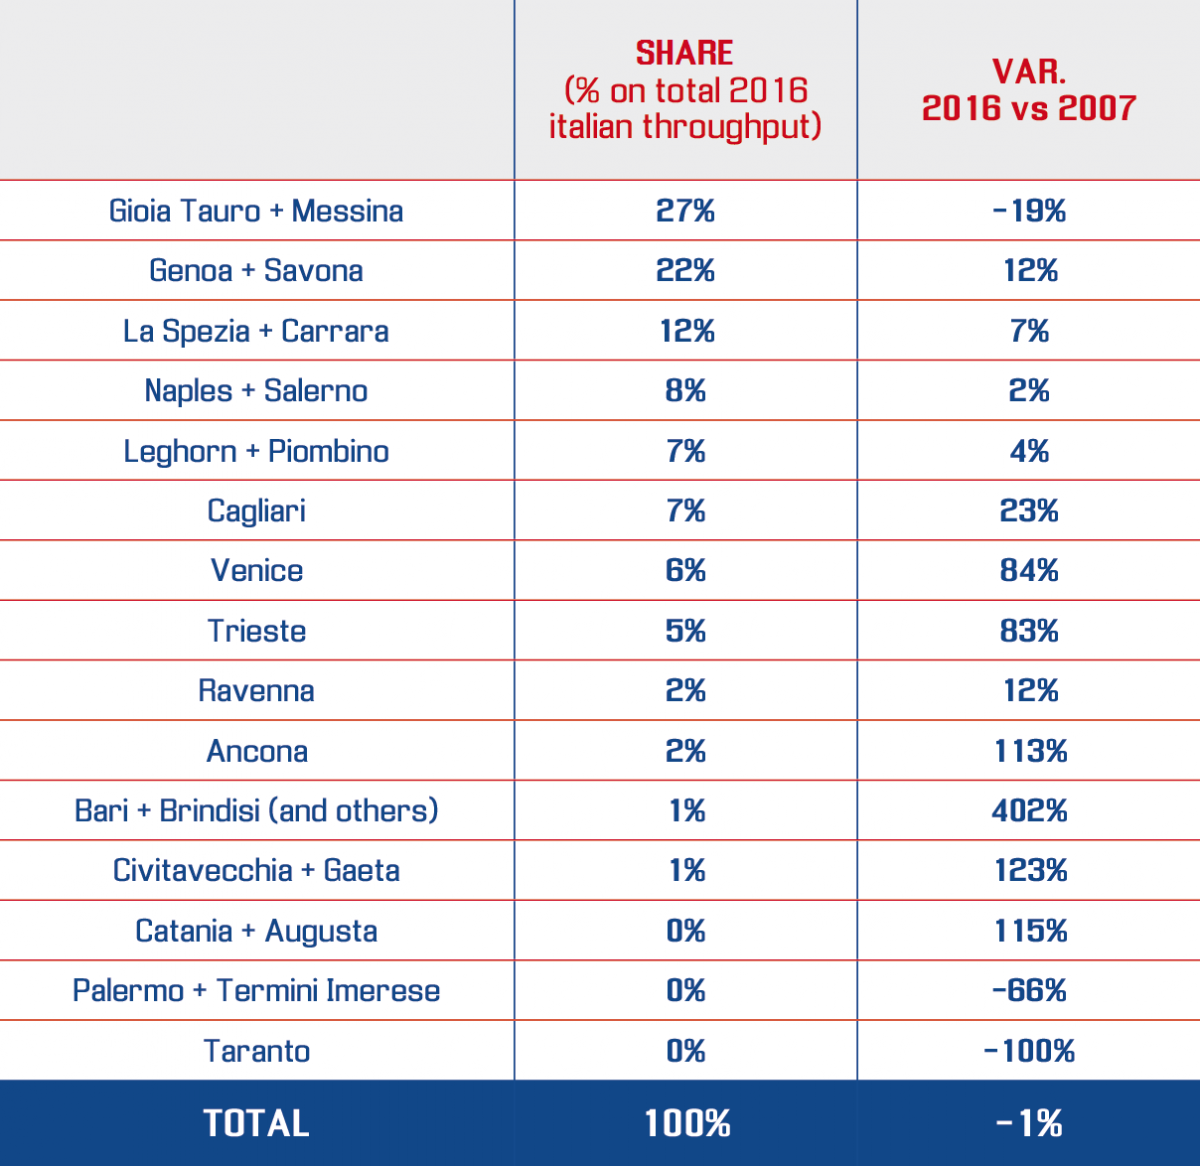
Whilst hubs in Italy are dealing with declining throughput volumes, Italian gateways achieved an increase in cargo volumes of 19.1% 2016 versus 2007, in spite of the challenging market conditions. Almost 7 m TEU entered or left the country via one of the national gateways in the last year, compared to 5.9 m TEU in 2007. However, when looking at 2016 in particular, the volume increase came in at only 1.2%. Looking at the new Italian ports governance reform, which reduced the port authorities from 26 to 15 port system authorities, we can observe some specific trends by analysing the figures of the last ten years.
The new Italian Port System Authorities and their share of total throughput in Italy
A close link
The differentiation between gateways and hubs is particularly interesting when considering the ratio between the development of Italian gross domestic product (GDP) and the development of the throughput figures of gateways. Over the past ten years, we can observe a clear trend when looking at the increase of the throughput figures in connection with the development of the GDP. The yearly increase in throughput figures of gateways used to be up to six times higher than the growth of the year-on-year GDP in the 2009-2012 period. The ratio further increased during the 2013-2015 period up to 20 times.
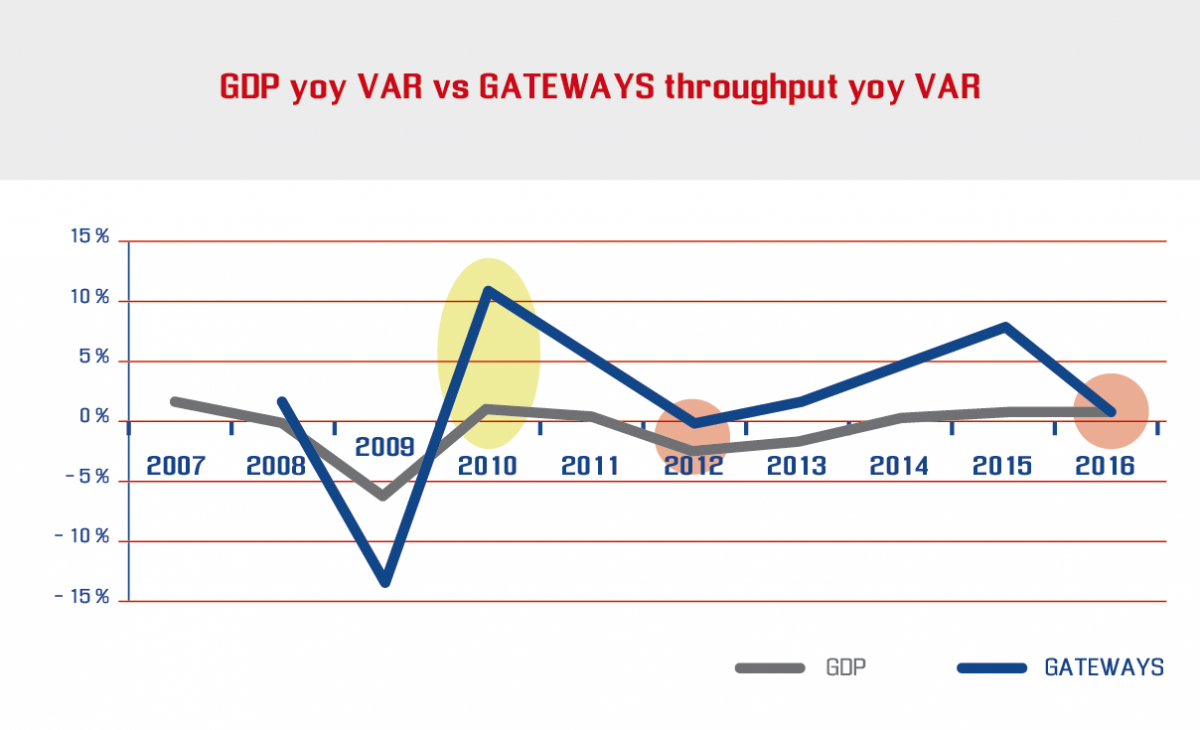
However, 2016 recorded an end to this development. Whilst the GDP increased by just under 1% compared to 2015, the handling volume of Italian gateways improved only marginally by 1.1%, leaving it almost on a par with the GDP development and therefore reflecting a general global trend as recently reported in the key note of JOC European Container Trade conference, held in Hamburg on September 2016.
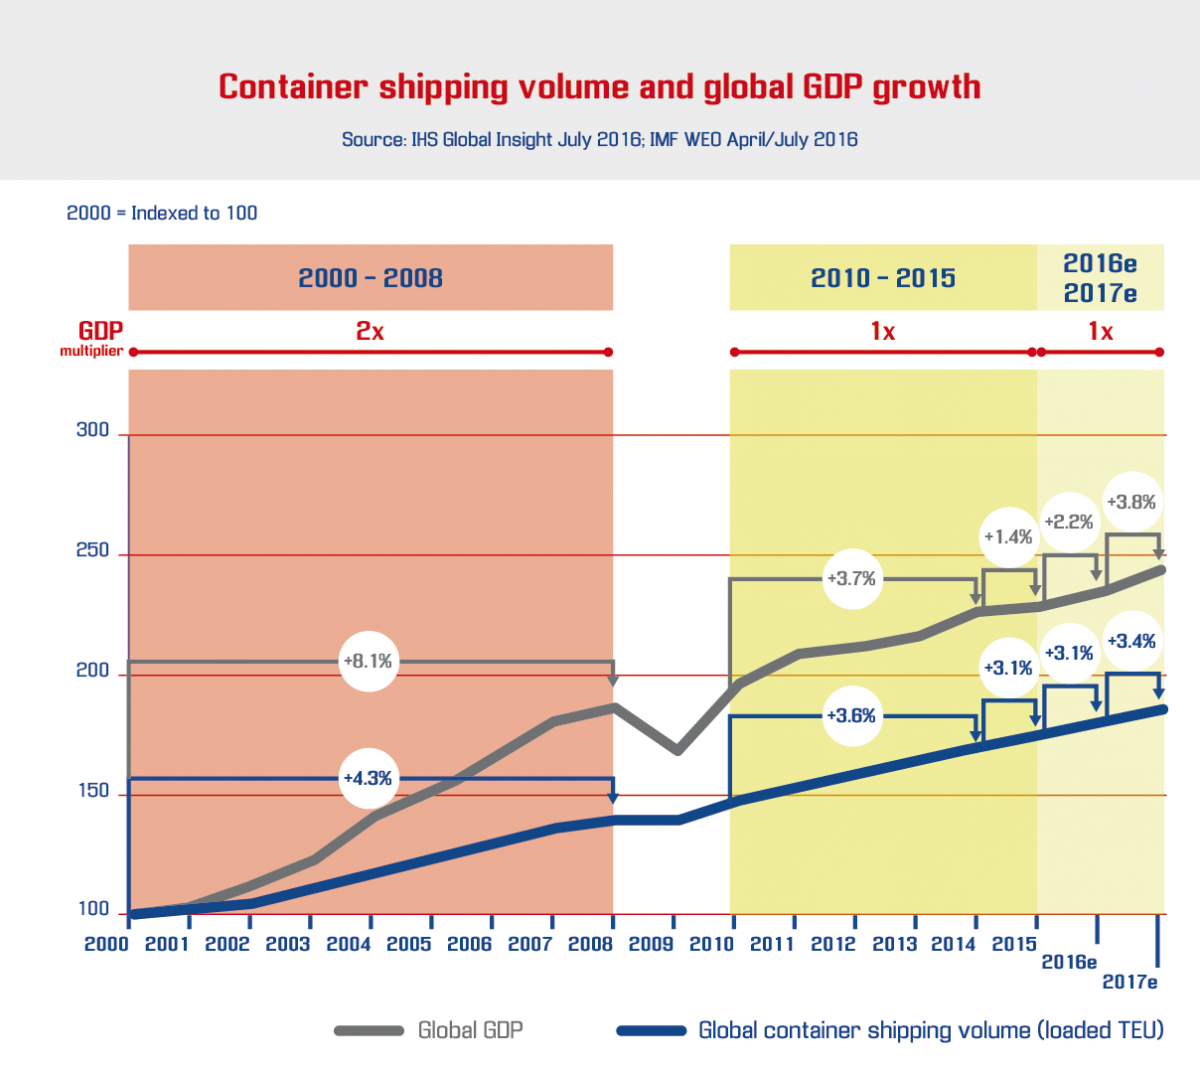
This development is a clear indicator that Italian container terminals have to look at solutions to drive volume growth which is mandatory for the return of investments required to welcome the increasing tonnage deployed by the global carriers.
Contship recently released the Group’s 2016 results. Click HERE to read the official press release issued in January 2017.


